Review


clusterin  (BioVendor Instruments)


Bioz Verified Symbol BioVendor Instruments is a verified supplier
Bioz Manufacturer Symbol BioVendor Instruments manufactures this product  
  • Logo
  • About
  • News
  • Press Release
  • Team
  • Advisors
  • Partners
  • Contact
  • Bioz Stars
  • Bioz vStars
  • 90

    Structured Review

    BioVendor Instruments clusterin
    a. The mass spectrometry findings of the CD33 and CD45 interaction were validated in THP-1 cells using the proximity ligation assay (PLA). Knock-out (KO) of CD33 from the THP-1 cell line led to the elimination of the interaction between CD33 and CD45, as detected by PLA. b. Combining THP-1 cells with either CD33 KO or CD45 KO via CRISPR/Cas9 leads to a reduction in the interaction between CD33 and CD45, suggesting that the interaction is occurring in cis. c. In a solid phase binding assay, recombinant human CD33 bound to immobilized recombinant human CD45 in a dose dependent manner. Increasing concentrations of recombinant hCD33-Fc (0.005µg/mL-5µg/mL) were incubated overnight at 4°C to recombinant hCD45 coated plates and an anti-human Fc antibody was used to detect recombinant bound hCD33. Each dot represents the average of three independent experiments. Two-way ANOVA with Tukey’s multiple comparison test, p*<0.05, p**<0.01, p***<0.001. Asterisks denote comparison of 0.5 μg/mL (blue asterisks) or 1 μg/mL (black asterisk) to 0 μg/mL CD45 concentration treatment. d. Representative images of CD33-CD45 PLA signal in CD33 mutant THP-1 cell lines. Mutations in the sialic acid binding domain (R119K) and the ITIM (Y340F) disrupt the interaction between CD33 and CD45 in THP-1 monocytes, as demonstrated by reduced PLA signal. Mutation in the ITIM-like domain (Y358F) leads to a reduction in CD33-CD45 interaction, as does the double mutant (Y358F/Y340F). e. Quantification of the CD33-CD45 PLA signal in each mutant THP-1 line, as PLA intensity per DAPI positive cell. Each dot represents a technical replicate. Unpaired t-test. *p<0.05, **p<0.01. f. Median fluorescence intensity of CD33-CD45 Flow Cytometry PLA in primary monocytes from 10 individuals, with and without pretreatment with 60nM <t>clusterin</t> (CLU) for 15 minutes. Error bars = mean + SEM. ***p<0.001, paired t-test. g. Representative overlay flow cytometry histogram of CD33-CD45 PLA fluorescent signal from monocytes with and without pretreatment with 60nM clusterin for 15 minutes. h. Median fluorescence intensity of CD33-CD45 PLA in primary monocytes from individuals genotyped for CD33 rs3865444 . N = 16 rs3865444 AA and 18 rs3865444 CC . Error bars = mean + SEM. *p<0.05, unpaired t-test. i. Representative overlayed flow cytometry histogram of PLA fluorescent signal from one CD33 rs3865444 AA and one CD33 rs3865444 CC individual.
    Clusterin, supplied by BioVendor Instruments, used in various techniques. Bioz Stars score: 90/100, based on 13 PubMed citations. ZERO BIAS - scores, article reviews, protocol conditions and more
    https://www.bioz.com/result/clusterin/product/BioVendor Instruments
    Average 90 stars, based on 13 article reviews
    clusterin - by Bioz Stars, 2026-03
    90/100 stars

    Images

    1) Product Images from "CD33-CD45 Interaction Reveals a Mechanistic Link to Alzheimer’s Disease Susceptibility"

    Article Title: CD33-CD45 Interaction Reveals a Mechanistic Link to Alzheimer’s Disease Susceptibility

    Journal: bioRxiv

    doi: 10.1101/2025.07.28.667311

    a. The mass spectrometry findings of the CD33 and CD45 interaction were validated in THP-1 cells using the proximity ligation assay (PLA). Knock-out (KO) of CD33 from the THP-1 cell line led to the elimination of the interaction between CD33 and CD45, as detected by PLA. b. Combining THP-1 cells with either CD33 KO or CD45 KO via CRISPR/Cas9 leads to a reduction in the interaction between CD33 and CD45, suggesting that the interaction is occurring in cis. c. In a solid phase binding assay, recombinant human CD33 bound to immobilized recombinant human CD45 in a dose dependent manner. Increasing concentrations of recombinant hCD33-Fc (0.005µg/mL-5µg/mL) were incubated overnight at 4°C to recombinant hCD45 coated plates and an anti-human Fc antibody was used to detect recombinant bound hCD33. Each dot represents the average of three independent experiments. Two-way ANOVA with Tukey’s multiple comparison test, p*<0.05, p**<0.01, p***<0.001. Asterisks denote comparison of 0.5 μg/mL (blue asterisks) or 1 μg/mL (black asterisk) to 0 μg/mL CD45 concentration treatment. d. Representative images of CD33-CD45 PLA signal in CD33 mutant THP-1 cell lines. Mutations in the sialic acid binding domain (R119K) and the ITIM (Y340F) disrupt the interaction between CD33 and CD45 in THP-1 monocytes, as demonstrated by reduced PLA signal. Mutation in the ITIM-like domain (Y358F) leads to a reduction in CD33-CD45 interaction, as does the double mutant (Y358F/Y340F). e. Quantification of the CD33-CD45 PLA signal in each mutant THP-1 line, as PLA intensity per DAPI positive cell. Each dot represents a technical replicate. Unpaired t-test. *p<0.05, **p<0.01. f. Median fluorescence intensity of CD33-CD45 Flow Cytometry PLA in primary monocytes from 10 individuals, with and without pretreatment with 60nM clusterin (CLU) for 15 minutes. Error bars = mean + SEM. ***p<0.001, paired t-test. g. Representative overlay flow cytometry histogram of CD33-CD45 PLA fluorescent signal from monocytes with and without pretreatment with 60nM clusterin for 15 minutes. h. Median fluorescence intensity of CD33-CD45 PLA in primary monocytes from individuals genotyped for CD33 rs3865444 . N = 16 rs3865444 AA and 18 rs3865444 CC . Error bars = mean + SEM. *p<0.05, unpaired t-test. i. Representative overlayed flow cytometry histogram of PLA fluorescent signal from one CD33 rs3865444 AA and one CD33 rs3865444 CC individual.
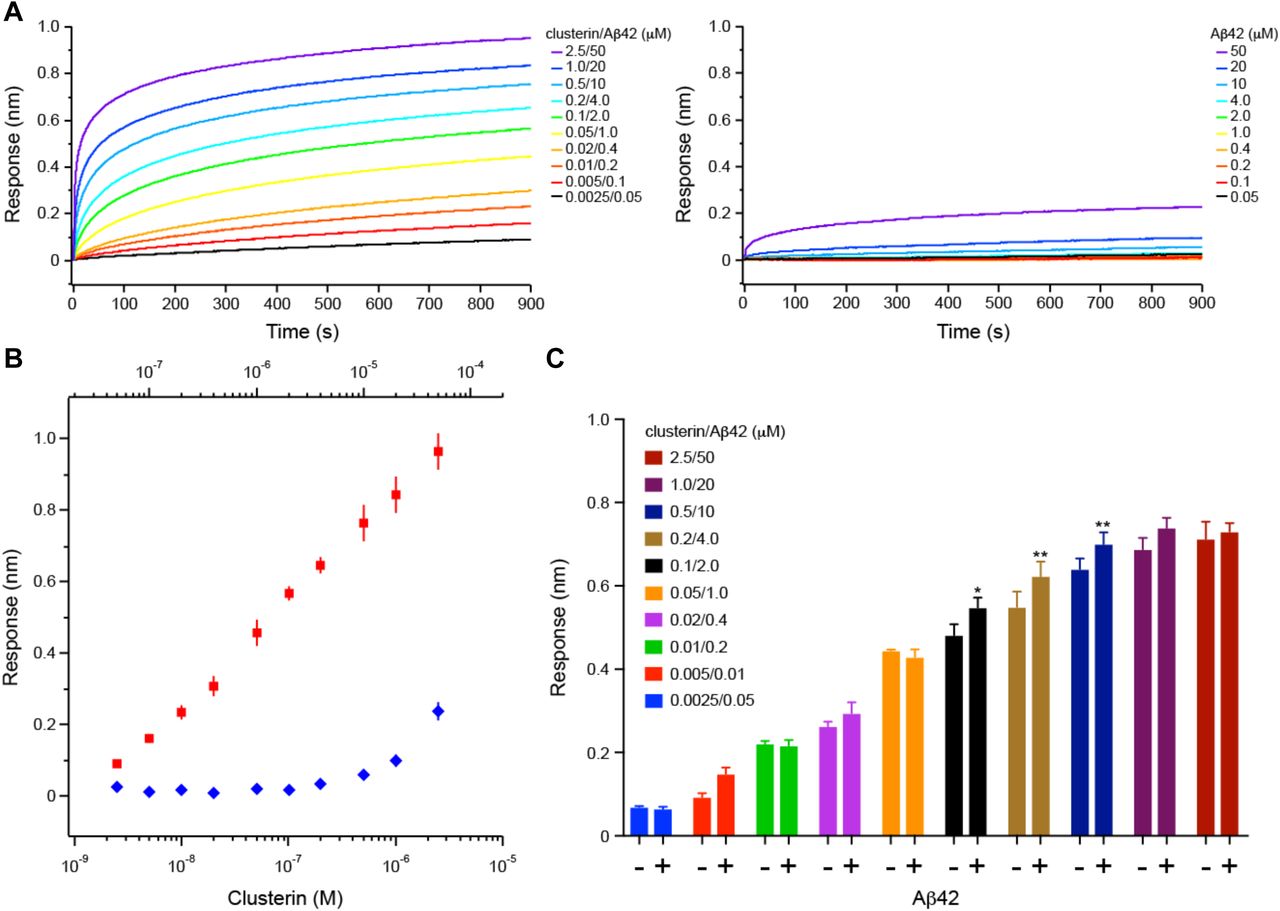
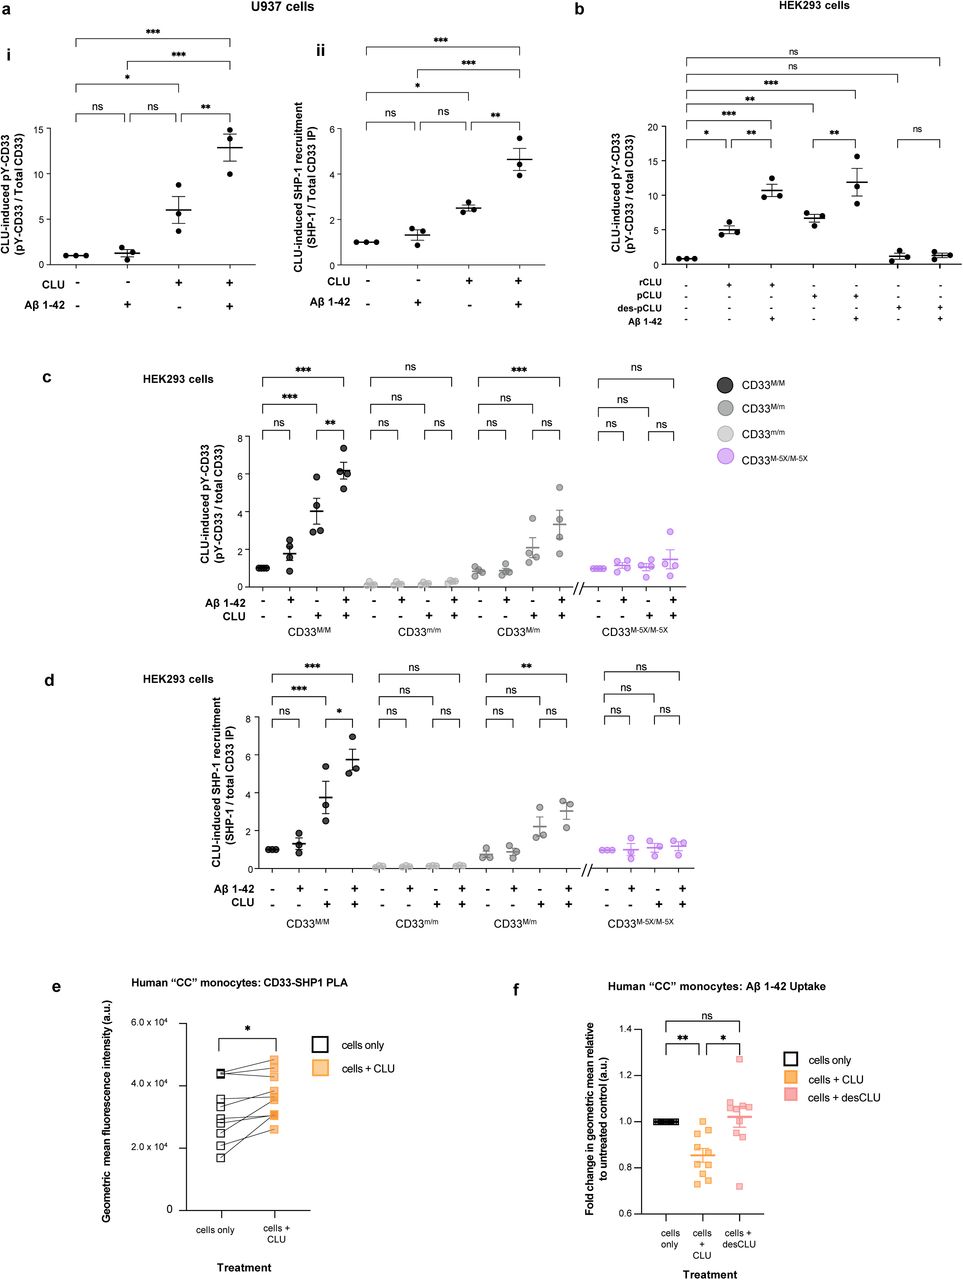
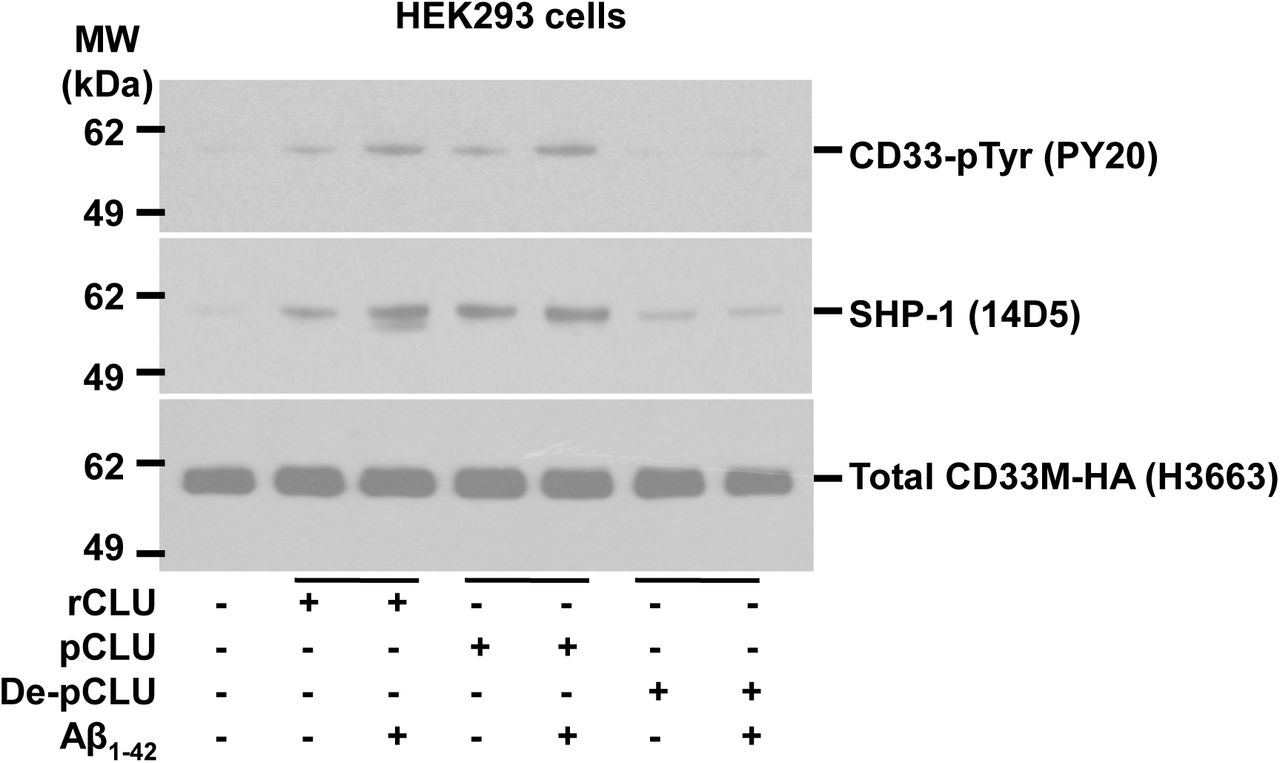
    Figure Legend Snippet: a. The mass spectrometry findings of the CD33 and CD45 interaction were validated in THP-1 cells using the proximity ligation assay (PLA). Knock-out (KO) of CD33 from the THP-1 cell line led to the elimination of the interaction between CD33 and CD45, as detected by PLA. b. Combining THP-1 cells with either CD33 KO or CD45 KO via CRISPR/Cas9 leads to a reduction in the interaction between CD33 and CD45, suggesting that the interaction is occurring in cis. c. In a solid phase binding assay, recombinant human CD33 bound to immobilized recombinant human CD45 in a dose dependent manner. Increasing concentrations of recombinant hCD33-Fc (0.005µg/mL-5µg/mL) were incubated overnight at 4°C to recombinant hCD45 coated plates and an anti-human Fc antibody was used to detect recombinant bound hCD33. Each dot represents the average of three independent experiments. Two-way ANOVA with Tukey’s multiple comparison test, p*<0.05, p**<0.01, p***<0.001. Asterisks denote comparison of 0.5 μg/mL (blue asterisks) or 1 μg/mL (black asterisk) to 0 μg/mL CD45 concentration treatment. d. Representative images of CD33-CD45 PLA signal in CD33 mutant THP-1 cell lines. Mutations in the sialic acid binding domain (R119K) and the ITIM (Y340F) disrupt the interaction between CD33 and CD45 in THP-1 monocytes, as demonstrated by reduced PLA signal. Mutation in the ITIM-like domain (Y358F) leads to a reduction in CD33-CD45 interaction, as does the double mutant (Y358F/Y340F). e. Quantification of the CD33-CD45 PLA signal in each mutant THP-1 line, as PLA intensity per DAPI positive cell. Each dot represents a technical replicate. Unpaired t-test. *p<0.05, **p<0.01. f. Median fluorescence intensity of CD33-CD45 Flow Cytometry PLA in primary monocytes from 10 individuals, with and without pretreatment with 60nM clusterin (CLU) for 15 minutes. Error bars = mean + SEM. ***p<0.001, paired t-test. g. Representative overlay flow cytometry histogram of CD33-CD45 PLA fluorescent signal from monocytes with and without pretreatment with 60nM clusterin for 15 minutes. h. Median fluorescence intensity of CD33-CD45 PLA in primary monocytes from individuals genotyped for CD33 rs3865444 . N = 16 rs3865444 AA and 18 rs3865444 CC . Error bars = mean + SEM. *p<0.05, unpaired t-test. i. Representative overlayed flow cytometry histogram of PLA fluorescent signal from one CD33 rs3865444 AA and one CD33 rs3865444 CC individual.

    Techniques Used: Mass Spectrometry, Proximity Ligation Assay, Knock-Out, CRISPR, Binding Assay, Recombinant, Incubation, Comparison, Concentration Assay, Mutagenesis, Fluorescence, Flow Cytometry


    Similar Products

    90
    BioVendor Instruments clusterin
    a. The mass spectrometry findings of the CD33 and CD45 interaction were validated in THP-1 cells using the proximity ligation assay (PLA). Knock-out (KO) of CD33 from the THP-1 cell line led to the elimination of the interaction between CD33 and CD45, as detected by PLA. b. Combining THP-1 cells with either CD33 KO or CD45 KO via CRISPR/Cas9 leads to a reduction in the interaction between CD33 and CD45, suggesting that the interaction is occurring in cis. c. In a solid phase binding assay, recombinant human CD33 bound to immobilized recombinant human CD45 in a dose dependent manner. Increasing concentrations of recombinant hCD33-Fc (0.005µg/mL-5µg/mL) were incubated overnight at 4°C to recombinant hCD45 coated plates and an anti-human Fc antibody was used to detect recombinant bound hCD33. Each dot represents the average of three independent experiments. Two-way ANOVA with Tukey’s multiple comparison test, p*<0.05, p**<0.01, p***<0.001. Asterisks denote comparison of 0.5 μg/mL (blue asterisks) or 1 μg/mL (black asterisk) to 0 μg/mL CD45 concentration treatment. d. Representative images of CD33-CD45 PLA signal in CD33 mutant THP-1 cell lines. Mutations in the sialic acid binding domain (R119K) and the ITIM (Y340F) disrupt the interaction between CD33 and CD45 in THP-1 monocytes, as demonstrated by reduced PLA signal. Mutation in the ITIM-like domain (Y358F) leads to a reduction in CD33-CD45 interaction, as does the double mutant (Y358F/Y340F). e. Quantification of the CD33-CD45 PLA signal in each mutant THP-1 line, as PLA intensity per DAPI positive cell. Each dot represents a technical replicate. Unpaired t-test. *p<0.05, **p<0.01. f. Median fluorescence intensity of CD33-CD45 Flow Cytometry PLA in primary monocytes from 10 individuals, with and without pretreatment with 60nM <t>clusterin</t> (CLU) for 15 minutes. Error bars = mean + SEM. ***p<0.001, paired t-test. g. Representative overlay flow cytometry histogram of CD33-CD45 PLA fluorescent signal from monocytes with and without pretreatment with 60nM clusterin for 15 minutes. h. Median fluorescence intensity of CD33-CD45 PLA in primary monocytes from individuals genotyped for CD33 rs3865444 . N = 16 rs3865444 AA and 18 rs3865444 CC . Error bars = mean + SEM. *p<0.05, unpaired t-test. i. Representative overlayed flow cytometry histogram of PLA fluorescent signal from one CD33 rs3865444 AA and one CD33 rs3865444 CC individual.
    Clusterin, supplied by BioVendor Instruments, used in various techniques. Bioz Stars score: 90/100, based on 1 PubMed citations. ZERO BIAS - scores, article reviews, protocol conditions and more
    https://www.bioz.com/result/clusterin/product/BioVendor Instruments
    Average 90 stars, based on 1 article reviews
    clusterin - by Bioz Stars, 2026-03
    90/100 stars
      Buy from Supplier

    90
    BioVendor Instruments native human plasma derived clusterin
    A. Binding curves of <t>clusterin/Aβ42</t> mixture (left panel) or Aβ42 (right panel). Each binding curve is the average of four independent measurements. Clusterin and Aβ42 concentrations are indicated. B. Steady-state BLI analysis of the clusterin/Aβ42 mixture (red square) or Aβ42 (blue diamond) binding to CD33 M ECD. Error bars represent SD. C. The bar chart of each data point presented in B. Error bars represent SD. Statistical analysis was performed using two-way ANOVA followed by Bonferroni’s multiple comparison test (n = 4, * p <0.05, ** p <0.01 vs clusterin alone).
    Native Human Plasma Derived Clusterin, supplied by BioVendor Instruments, used in various techniques. Bioz Stars score: 90/100, based on 1 PubMed citations. ZERO BIAS - scores, article reviews, protocol conditions and more
    https://www.bioz.com/result/native human plasma derived clusterin/product/BioVendor Instruments
    Average 90 stars, based on 1 article reviews
    native human plasma derived clusterin - by Bioz Stars, 2026-03
    90/100 stars
      Buy from Supplier

    90
    BioVendor Instruments clusterin human native
    A. Binding curves of <t>clusterin/Aβ42</t> mixture (left panel) or Aβ42 (right panel). Each binding curve is the average of four independent measurements. Clusterin and Aβ42 concentrations are indicated. B. Steady-state BLI analysis of the clusterin/Aβ42 mixture (red square) or Aβ42 (blue diamond) binding to CD33 M ECD. Error bars represent SD. C. The bar chart of each data point presented in B. Error bars represent SD. Statistical analysis was performed using two-way ANOVA followed by Bonferroni’s multiple comparison test (n = 4, * p <0.05, ** p <0.01 vs clusterin alone).
    Clusterin Human Native, supplied by BioVendor Instruments, used in various techniques. Bioz Stars score: 90/100, based on 1 PubMed citations. ZERO BIAS - scores, article reviews, protocol conditions and more
    https://www.bioz.com/result/clusterin human native/product/BioVendor Instruments
    Average 90 stars, based on 1 article reviews
    clusterin human native - by Bioz Stars, 2026-03
    90/100 stars
      Buy from Supplier

    90
    BioVendor Instruments human native glycosylated apoj
    A. Binding curves of <t>clusterin/Aβ42</t> mixture (left panel) or Aβ42 (right panel). Each binding curve is the average of four independent measurements. Clusterin and Aβ42 concentrations are indicated. B. Steady-state BLI analysis of the clusterin/Aβ42 mixture (red square) or Aβ42 (blue diamond) binding to CD33 M ECD. Error bars represent SD. C. The bar chart of each data point presented in B. Error bars represent SD. Statistical analysis was performed using two-way ANOVA followed by Bonferroni’s multiple comparison test (n = 4, * p <0.05, ** p <0.01 vs clusterin alone).
    Human Native Glycosylated Apoj, supplied by BioVendor Instruments, used in various techniques. Bioz Stars score: 90/100, based on 1 PubMed citations. ZERO BIAS - scores, article reviews, protocol conditions and more
    https://www.bioz.com/result/human native glycosylated apoj/product/BioVendor Instruments
    Average 90 stars, based on 1 article reviews
    human native glycosylated apoj - by Bioz Stars, 2026-03
    90/100 stars
      Buy from Supplier

    86
    BioVendor Instruments cluhuman clusterin elisa
    A. Binding curves of <t>clusterin/Aβ42</t> mixture (left panel) or Aβ42 (right panel). Each binding curve is the average of four independent measurements. Clusterin and Aβ42 concentrations are indicated. B. Steady-state BLI analysis of the clusterin/Aβ42 mixture (red square) or Aβ42 (blue diamond) binding to CD33 M ECD. Error bars represent SD. C. The bar chart of each data point presented in B. Error bars represent SD. Statistical analysis was performed using two-way ANOVA followed by Bonferroni’s multiple comparison test (n = 4, * p <0.05, ** p <0.01 vs clusterin alone).
    Cluhuman Clusterin Elisa, supplied by BioVendor Instruments, used in various techniques. Bioz Stars score: 86/100, based on 1 PubMed citations. ZERO BIAS - scores, article reviews, protocol conditions and more
    https://www.bioz.com/result/cluhuman clusterin elisa/product/BioVendor Instruments
    Average 86 stars, based on 1 article reviews
    cluhuman clusterin elisa - by Bioz Stars, 2026-03
    86/100 stars
      Buy from Supplier

    90
    BioVendor Instruments native clusterin
    A. Binding curves of <t>clusterin/Aβ42</t> mixture (left panel) or Aβ42 (right panel). Each binding curve is the average of four independent measurements. Clusterin and Aβ42 concentrations are indicated. B. Steady-state BLI analysis of the clusterin/Aβ42 mixture (red square) or Aβ42 (blue diamond) binding to CD33 M ECD. Error bars represent SD. C. The bar chart of each data point presented in B. Error bars represent SD. Statistical analysis was performed using two-way ANOVA followed by Bonferroni’s multiple comparison test (n = 4, * p <0.05, ** p <0.01 vs clusterin alone).
    Native Clusterin, supplied by BioVendor Instruments, used in various techniques. Bioz Stars score: 90/100, based on 1 PubMed citations. ZERO BIAS - scores, article reviews, protocol conditions and more
    https://www.bioz.com/result/native clusterin/product/BioVendor Instruments
    Average 90 stars, based on 1 article reviews
    native clusterin - by Bioz Stars, 2026-03
    90/100 stars
      Buy from Supplier

    90
    BioVendor Instruments human plasma
    A. Binding curves of <t>clusterin/Aβ42</t> mixture (left panel) or Aβ42 (right panel). Each binding curve is the average of four independent measurements. Clusterin and Aβ42 concentrations are indicated. B. Steady-state BLI analysis of the clusterin/Aβ42 mixture (red square) or Aβ42 (blue diamond) binding to CD33 M ECD. Error bars represent SD. C. The bar chart of each data point presented in B. Error bars represent SD. Statistical analysis was performed using two-way ANOVA followed by Bonferroni’s multiple comparison test (n = 4, * p <0.05, ** p <0.01 vs clusterin alone).
    Human Plasma, supplied by BioVendor Instruments, used in various techniques. Bioz Stars score: 90/100, based on 1 PubMed citations. ZERO BIAS - scores, article reviews, protocol conditions and more
    https://www.bioz.com/result/human plasma/product/BioVendor Instruments
    Average 90 stars, based on 1 article reviews
    human plasma - by Bioz Stars, 2026-03
    90/100 stars
      Buy from Supplier

    Image Search Results


    a. The mass spectrometry findings of the CD33 and CD45 interaction were validated in THP-1 cells using the proximity ligation assay (PLA). Knock-out (KO) of CD33 from the THP-1 cell line led to the elimination of the interaction between CD33 and CD45, as detected by PLA. b. Combining THP-1 cells with either CD33 KO or CD45 KO via CRISPR/Cas9 leads to a reduction in the interaction between CD33 and CD45, suggesting that the interaction is occurring in cis. c. In a solid phase binding assay, recombinant human CD33 bound to immobilized recombinant human CD45 in a dose dependent manner. Increasing concentrations of recombinant hCD33-Fc (0.005µg/mL-5µg/mL) were incubated overnight at 4°C to recombinant hCD45 coated plates and an anti-human Fc antibody was used to detect recombinant bound hCD33. Each dot represents the average of three independent experiments. Two-way ANOVA with Tukey’s multiple comparison test, p*<0.05, p**<0.01, p***<0.001. Asterisks denote comparison of 0.5 μg/mL (blue asterisks) or 1 μg/mL (black asterisk) to 0 μg/mL CD45 concentration treatment. d. Representative images of CD33-CD45 PLA signal in CD33 mutant THP-1 cell lines. Mutations in the sialic acid binding domain (R119K) and the ITIM (Y340F) disrupt the interaction between CD33 and CD45 in THP-1 monocytes, as demonstrated by reduced PLA signal. Mutation in the ITIM-like domain (Y358F) leads to a reduction in CD33-CD45 interaction, as does the double mutant (Y358F/Y340F). e. Quantification of the CD33-CD45 PLA signal in each mutant THP-1 line, as PLA intensity per DAPI positive cell. Each dot represents a technical replicate. Unpaired t-test. *p<0.05, **p<0.01. f. Median fluorescence intensity of CD33-CD45 Flow Cytometry PLA in primary monocytes from 10 individuals, with and without pretreatment with 60nM clusterin (CLU) for 15 minutes. Error bars = mean + SEM. ***p<0.001, paired t-test. g. Representative overlay flow cytometry histogram of CD33-CD45 PLA fluorescent signal from monocytes with and without pretreatment with 60nM clusterin for 15 minutes. h. Median fluorescence intensity of CD33-CD45 PLA in primary monocytes from individuals genotyped for CD33 rs3865444 . N = 16 rs3865444 AA and 18 rs3865444 CC . Error bars = mean + SEM. *p<0.05, unpaired t-test. i. Representative overlayed flow cytometry histogram of PLA fluorescent signal from one CD33 rs3865444 AA and one CD33 rs3865444 CC individual.

    Journal: bioRxiv

    Article Title: CD33-CD45 Interaction Reveals a Mechanistic Link to Alzheimer’s Disease Susceptibility

    doi: 10.1101/2025.07.28.667311

    Figure Lengend Snippet: a. The mass spectrometry findings of the CD33 and CD45 interaction were validated in THP-1 cells using the proximity ligation assay (PLA). Knock-out (KO) of CD33 from the THP-1 cell line led to the elimination of the interaction between CD33 and CD45, as detected by PLA. b. Combining THP-1 cells with either CD33 KO or CD45 KO via CRISPR/Cas9 leads to a reduction in the interaction between CD33 and CD45, suggesting that the interaction is occurring in cis. c. In a solid phase binding assay, recombinant human CD33 bound to immobilized recombinant human CD45 in a dose dependent manner. Increasing concentrations of recombinant hCD33-Fc (0.005µg/mL-5µg/mL) were incubated overnight at 4°C to recombinant hCD45 coated plates and an anti-human Fc antibody was used to detect recombinant bound hCD33. Each dot represents the average of three independent experiments. Two-way ANOVA with Tukey’s multiple comparison test, p*<0.05, p**<0.01, p***<0.001. Asterisks denote comparison of 0.5 μg/mL (blue asterisks) or 1 μg/mL (black asterisk) to 0 μg/mL CD45 concentration treatment. d. Representative images of CD33-CD45 PLA signal in CD33 mutant THP-1 cell lines. Mutations in the sialic acid binding domain (R119K) and the ITIM (Y340F) disrupt the interaction between CD33 and CD45 in THP-1 monocytes, as demonstrated by reduced PLA signal. Mutation in the ITIM-like domain (Y358F) leads to a reduction in CD33-CD45 interaction, as does the double mutant (Y358F/Y340F). e. Quantification of the CD33-CD45 PLA signal in each mutant THP-1 line, as PLA intensity per DAPI positive cell. Each dot represents a technical replicate. Unpaired t-test. *p<0.05, **p<0.01. f. Median fluorescence intensity of CD33-CD45 Flow Cytometry PLA in primary monocytes from 10 individuals, with and without pretreatment with 60nM clusterin (CLU) for 15 minutes. Error bars = mean + SEM. ***p<0.001, paired t-test. g. Representative overlay flow cytometry histogram of CD33-CD45 PLA fluorescent signal from monocytes with and without pretreatment with 60nM clusterin for 15 minutes. h. Median fluorescence intensity of CD33-CD45 PLA in primary monocytes from individuals genotyped for CD33 rs3865444 . N = 16 rs3865444 AA and 18 rs3865444 CC . Error bars = mean + SEM. *p<0.05, unpaired t-test. i. Representative overlayed flow cytometry histogram of PLA fluorescent signal from one CD33 rs3865444 AA and one CD33 rs3865444 CC individual.

    Article Snippet: 0.1mg of clusterin (BioVendor, Clusterin Human Native Protein, Human Plasma; Cat. No. 50-206-9196) was resuspended in 108μl of sterile water to make a 12μM stock.

    Techniques: Mass Spectrometry, Proximity Ligation Assay, Knock-Out, CRISPR, Binding Assay, Recombinant, Incubation, Comparison, Concentration Assay, Mutagenesis, Fluorescence, Flow Cytometry

    A. Binding curves of clusterin/Aβ42 mixture (left panel) or Aβ42 (right panel). Each binding curve is the average of four independent measurements. Clusterin and Aβ42 concentrations are indicated. B. Steady-state BLI analysis of the clusterin/Aβ42 mixture (red square) or Aβ42 (blue diamond) binding to CD33 M ECD. Error bars represent SD. C. The bar chart of each data point presented in B. Error bars represent SD. Statistical analysis was performed using two-way ANOVA followed by Bonferroni’s multiple comparison test (n = 4, * p <0.05, ** p <0.01 vs clusterin alone).

    Journal: bioRxiv

    Article Title: CD33 and clusterin interact biophysically and genetically to modulate Alzheimer risk

    doi: 10.1101/2025.07.29.667318

    Figure Lengend Snippet: A. Binding curves of clusterin/Aβ42 mixture (left panel) or Aβ42 (right panel). Each binding curve is the average of four independent measurements. Clusterin and Aβ42 concentrations are indicated. B. Steady-state BLI analysis of the clusterin/Aβ42 mixture (red square) or Aβ42 (blue diamond) binding to CD33 M ECD. Error bars represent SD. C. The bar chart of each data point presented in B. Error bars represent SD. Statistical analysis was performed using two-way ANOVA followed by Bonferroni’s multiple comparison test (n = 4, * p <0.05, ** p <0.01 vs clusterin alone).

    Article Snippet: Native human plasma-derived clusterin (BioVendor R&D) was reconstituted in sterile water according to the manufacturer’s instructions. iMGs were treated with 300 nM clusterin or sterile water in complete microglia medium for 24 hours.

    Techniques: Binding Assay, Comparison

    a. Human plasma CLU alone, and especially human CLU + Aβ oligomers induce ITIM tyrosine phosphorylation of endogenous CD33 (left panel) and recruitment of endogenous SHP-1 (right panel) in human monocytic U937 cells. Quantification of CD33 phosphotyrosine (pY20 antibody immunoreactive anti-CD33 IP products) and of SHP-1 recruitment (anti-SHP-1 immunoreactive anti-CD33 IP products) using band intensity (representative blots are in . * = p <0.05; *** = p <0.001; NS = not significant; ANOVA with Tukey post-hoc correction; error bars = mean ± SEM; For CD33 M -pTyr, No treatment: 1.00±0.0; Aβ treatment: 1.367±0.4107; CLU treatment: 6.283±1.667; CLU + Aβ treatment: 11.92±1.116; For SHP-1, No treatment: 1.00±0.0; Aβ treatment: 1.447±0.2726; CLU treatment: 2.589±0.0688; CLU + Aβ treatment: 4.362±0.5971, n ≥ 3 independent biological replications. b. Recombinant human clusterin (rCLU) and native human plasma clusterin (pCLU), but not desialylated clusterin (desCLU) equivalently activate CD33 ITIM phosphorylation and SHP-1 recruitment in HEK293 cells . CD33 tyrosine phosphorylation and SHP-1 recruitment were measured by western blots band intensity ratios for pY20-phosphotyrosine immunoreactive CD33 versus total CD33 by co-IP western blots. with different cell lines are available in . c. CLU + Aβ induces greater CD33 ITIM phosphorylation than CLU alone, but only in CD33M expressing cells. Quantification of western blots of anti-CD33 immunoprecipitates probed with pY20 anti-phosphotyrosine or anti-HA antibodies reveals that treatment with CLU alone, and especially treatment with CLU + Aβ oligomers, increases CD33 tyrosine phosphorylation in cells expressing either CD33M only or CD33 M plus CD33 m . No CD33 phosphorylation was observed in cells expressing only CD33 m , and very little in CD33 M-5X cells. n = 3 replications. Representative western blots are in . d. CLU + Aβ induces greater CD33 SHP-1 recruitment than CLU alone, but only in CD33M expressing cells. Quantification of western blots of anti-CD33 immunoprecipitates probed with SHP-1 or anti-HA antibodies reveals that treatment with CLU alone, and especially treatment with CLU + Aβ oligomers, increases SHP-1 recruitment in cells expressing either CD33M only or CD33 M plus CD33 m . No SHP-1 recruitment was observed in cells expressing only CD33 m , and very little in CD33 M-5X cells. n = 3 replications. Representative western blots are in . e. Treatment of human monocytes with 0.06 µM CLU for 15 min at 37°C increases binding of CD33 and SHP-1. Human monocytes (genotype CD33 rs3865444 CC ) were treated with CLU and then a proximity ligation assay (PLA) was performed to examine CD33-SHP-1 interaction. Median fluorescence intensity of the PLA of CD33-SHP-1 was measured and analyzed in relation to untreated monocytes from the same individuals. Data were analyzed using paired t-test on GraphPad Prism. *, p<0.05. f. CD33 rs3865444 CC risk genotype-dependent effect of CLUon monomeric Aβ1-42 uptake by human monocytes. Human monocytes (genotype CD33 rs3865444 CC ) were treated with either CLU or desCLU, and the effect on Aβ1-42 uptake was assessed by flow cytometry. CLU significantly reduces the Aβ 1-42 uptake compared to the media control or desCLU treatment. Data were analyzed using geometric mean intensity of HiLyte™ Fluor 647 conjugated Aβ 1-42, n = 10 unrelated donors each examined once. Each dot represents an individual donor. Data were analyzed using ANOVA on GraphPad Prism. **, p<0.01; *, p<0.05.

    Journal: bioRxiv

    Article Title: CD33 and clusterin interact biophysically and genetically to modulate Alzheimer risk

    doi: 10.1101/2025.07.29.667318

    Figure Lengend Snippet: a. Human plasma CLU alone, and especially human CLU + Aβ oligomers induce ITIM tyrosine phosphorylation of endogenous CD33 (left panel) and recruitment of endogenous SHP-1 (right panel) in human monocytic U937 cells. Quantification of CD33 phosphotyrosine (pY20 antibody immunoreactive anti-CD33 IP products) and of SHP-1 recruitment (anti-SHP-1 immunoreactive anti-CD33 IP products) using band intensity (representative blots are in . * = p <0.05; *** = p <0.001; NS = not significant; ANOVA with Tukey post-hoc correction; error bars = mean ± SEM; For CD33 M -pTyr, No treatment: 1.00±0.0; Aβ treatment: 1.367±0.4107; CLU treatment: 6.283±1.667; CLU + Aβ treatment: 11.92±1.116; For SHP-1, No treatment: 1.00±0.0; Aβ treatment: 1.447±0.2726; CLU treatment: 2.589±0.0688; CLU + Aβ treatment: 4.362±0.5971, n ≥ 3 independent biological replications. b. Recombinant human clusterin (rCLU) and native human plasma clusterin (pCLU), but not desialylated clusterin (desCLU) equivalently activate CD33 ITIM phosphorylation and SHP-1 recruitment in HEK293 cells . CD33 tyrosine phosphorylation and SHP-1 recruitment were measured by western blots band intensity ratios for pY20-phosphotyrosine immunoreactive CD33 versus total CD33 by co-IP western blots. with different cell lines are available in . c. CLU + Aβ induces greater CD33 ITIM phosphorylation than CLU alone, but only in CD33M expressing cells. Quantification of western blots of anti-CD33 immunoprecipitates probed with pY20 anti-phosphotyrosine or anti-HA antibodies reveals that treatment with CLU alone, and especially treatment with CLU + Aβ oligomers, increases CD33 tyrosine phosphorylation in cells expressing either CD33M only or CD33 M plus CD33 m . No CD33 phosphorylation was observed in cells expressing only CD33 m , and very little in CD33 M-5X cells. n = 3 replications. Representative western blots are in . d. CLU + Aβ induces greater CD33 SHP-1 recruitment than CLU alone, but only in CD33M expressing cells. Quantification of western blots of anti-CD33 immunoprecipitates probed with SHP-1 or anti-HA antibodies reveals that treatment with CLU alone, and especially treatment with CLU + Aβ oligomers, increases SHP-1 recruitment in cells expressing either CD33M only or CD33 M plus CD33 m . No SHP-1 recruitment was observed in cells expressing only CD33 m , and very little in CD33 M-5X cells. n = 3 replications. Representative western blots are in . e. Treatment of human monocytes with 0.06 µM CLU for 15 min at 37°C increases binding of CD33 and SHP-1. Human monocytes (genotype CD33 rs3865444 CC ) were treated with CLU and then a proximity ligation assay (PLA) was performed to examine CD33-SHP-1 interaction. Median fluorescence intensity of the PLA of CD33-SHP-1 was measured and analyzed in relation to untreated monocytes from the same individuals. Data were analyzed using paired t-test on GraphPad Prism. *, p<0.05. f. CD33 rs3865444 CC risk genotype-dependent effect of CLUon monomeric Aβ1-42 uptake by human monocytes. Human monocytes (genotype CD33 rs3865444 CC ) were treated with either CLU or desCLU, and the effect on Aβ1-42 uptake was assessed by flow cytometry. CLU significantly reduces the Aβ 1-42 uptake compared to the media control or desCLU treatment. Data were analyzed using geometric mean intensity of HiLyte™ Fluor 647 conjugated Aβ 1-42, n = 10 unrelated donors each examined once. Each dot represents an individual donor. Data were analyzed using ANOVA on GraphPad Prism. **, p<0.01; *, p<0.05.

    Article Snippet: Native human plasma-derived clusterin (BioVendor R&D) was reconstituted in sterile water according to the manufacturer’s instructions. iMGs were treated with 300 nM clusterin or sterile water in complete microglia medium for 24 hours.

    Techniques: Clinical Proteomics, Phospho-proteomics, Recombinant, Western Blot, Co-Immunoprecipitation Assay, Expressing, Binding Assay, Proximity Ligation Assay, Fluorescence, Flow Cytometry, Control

    Representative western blot of n = 3-4 independent biological replications with different cell lines for . Recombinant human clusterin (rCLU) and native human plasma clusterin (pCLU), but not desialylated clusterin equivalently activate CD33M ITIM phosphorylation and SHP-1 recruitment in HEK293 cells. CD33M tyrosine phosphorylation (top panel) and SHP-1 recruitment (middle panel) were measured by Western blots band intensity ratios for pY20-phosphotyrosine immunoreactive CD33M versus total CD33M (bottom panel) by co-IP western blots..

    Journal: bioRxiv

    Article Title: CD33 and clusterin interact biophysically and genetically to modulate Alzheimer risk

    doi: 10.1101/2025.07.29.667318

    Figure Lengend Snippet: Representative western blot of n = 3-4 independent biological replications with different cell lines for . Recombinant human clusterin (rCLU) and native human plasma clusterin (pCLU), but not desialylated clusterin equivalently activate CD33M ITIM phosphorylation and SHP-1 recruitment in HEK293 cells. CD33M tyrosine phosphorylation (top panel) and SHP-1 recruitment (middle panel) were measured by Western blots band intensity ratios for pY20-phosphotyrosine immunoreactive CD33M versus total CD33M (bottom panel) by co-IP western blots..

    Article Snippet: Native human plasma-derived clusterin (BioVendor R&D) was reconstituted in sterile water according to the manufacturer’s instructions. iMGs were treated with 300 nM clusterin or sterile water in complete microglia medium for 24 hours.

    Techniques: Western Blot, Recombinant, Clinical Proteomics, Phospho-proteomics, Co-Immunoprecipitation Assay